With the 2022 midterms’ now being in the rearview mirror, the performance of pollsters is again in the limelight. In this case, the conventional wisdom is that the polls overestimated Republican performance and led people to believe that this would be a “red wave” election when instead, the 2022 midterms were a “split decision”: Republicans lost a Senate seat and are now in the 49 seat minority; in the House, Republicans’ net gain of nine seats gives them a narrow 222 seat majority (compared to 213 seats for the Democrats). Does polling data support these accusations of poor pollster performance? Let’s evaluate.
ANALYSIS #1: GENERIC CONGRESSIONAL BALLOT
When evaluating pollster performance, JMC is most interested in what the “polling consensus” was the week before Election Day. In other words, the average of all polls released between November 1-8. And since the House of Representatives is the only legislative body whose members are all up for re-election every two years (35/100 Senate seats were up this year), the aggregate popular vote for all U.S. House candidates is an appropriate measure of the nation’s partisan “mood.”
Polling data compiled by Real Clear Politics showed that 50.7% of the House vote went to a Republican candidate while 47.8% went to a Democratic candidate (in other words, a 2.9% Republican lead). The average of polling conducted in that last week showed a 47.9-46.4% (or a 1.5%) Republican lead. If undecideds are allocated pro-rata, this would result in a polling average of 50.8-49.2% Republican/Democratic. In other words, the polls not only properly showed a Republican lead, but the “victory margin” was well within the margin of error, with a 1.4% understatement of the Republican margin. By that standard, polling (more specifically, generic ballot polling) was accurate.
ANALYSIS #2: SENATE/GOVERNOR’S RACES
There were 41 Senate/Governor’s races with publicly released polls the last week before Election Day. When looking at “pollster performance” for these races, JMC looks for two things: (1) the number of races where the polling average correctly/incorrectly said who would win, and (2) regardless of whether the polling average correctly assessed the winner/loser, how close the polling average was to the final result (JMC defines “close” as the polling average’s being within 5 points of the actual margin of victory).
Let’s first discuss the races where the polling averages were just wrong. Only 4/41 (or 10% of) races fit this description – the Governor’s races in Arizona and Wisconsin, and Senate races in Georgia and Nevada. However, it’s also worth noting that while the polling averages were wrong in those 4 instances, in no case was the “miss” greater than 4 points.
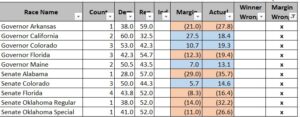
If we were instead to look at races where the margin of victory was materially misstated by the polling averages (JMC defines “material” as a miss of 5 points or more), 13 races were “missed” out of 41 Senate/Governor races. And of the 13 “misses”, 10 were not true “misses” that created improper expectations on Election Night – it was merely a case of pollsters understating the landslide percentages for those 10 races, although as an aside, it’s worth noting that in 7 of these 10 cases, it was the Republican landslide margin that was underestimated and/or an overstatement of the Democratic landslide. Those 10 races are shown below:
That leaves 3 races that were “true misses” – Governorships in Michigan and Oklahoma, and the Senate race in New Hampshire. In other words, late polling suggested upsets in those three races, when the end result showed that none of those three races were particularly close.
In other words, four close races (two Senate, two Governor) that Democrats clinched despite polling averages showing they would lose does not indicate a systemic polling failure, but instead shows polling errors within a reasonable margin of error. Plus, given general Republican distaste before Election Day for aggressive utilization of early voting as a means of ”getting out the vote”, it’s not unreasonable to attribute marginal Democratic gains (relative to polling averages in early November) to Democrats’ banking those early votes.
CONCLUSION
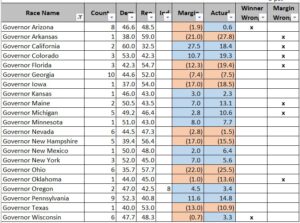
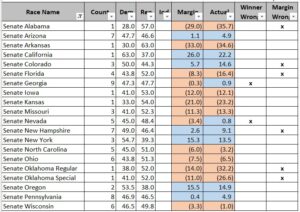
A poll is a snapshot of public opinion over a period of time. Taking that snapshot involves a random, representative sampling of voters. That sampling creates inherent error. But because polls can not perfectly predict who actually shows up to vote, if one party works on banking votes before Election Day, those activities are worth a few points, and in a close election, those few points can swing races. Which in multiple instances on Election Night is what happened. For transparency’s sake, the entire aggregated dataset is below:


