Now that the 2024 Presidential election cycle is in the past, the discussion that occurs every election cycle of whether pollsters “missed the mark” with regards to the Presidential election results is worth bringing up now. Let’s look at the data to evaluate whether or not pollsters “got it wrong” again.
JMC did similar analyses after both the 2016 and 2020 Presidential election cycles, and just like before, he is interested in seeing both (1) how accurate the polls were with regards to the national popular vote, and (2) how accurate the polls were with the vote in each of the swing states. In performing this analysis, JMC used both certified election results and publicly released polling data available from both Realclearpolitics.com and fivethirtyeight.com for the final seven days before Election Day.
ANALYSIS #1: NATIONAL POLLING
Even though the national popular vote (thanks to the Electoral College) does not truly matter in the election of a President, national polls are nevertheless a frequently used metric to evaluate which candidate is ahead/behind, or trending in either direction.
An examination of the average of all polls where fieldwork concluded between October 29 and November 4 (in other words, the final week before Election Day) shows a narrow Harris lead of 0.5% (in other words, a 48.9-48.4% lead in the national popular vote). Since the final margin was 49.7-48.2% for Trump over Harris (or a 1.5% margin), the Trump percentage was understated by 1.3%, while the Harris percentage was overstated by 0.7%. This is actually an improvement over 2020, when the Trump national popular vote was understated 3.3%/the Biden vote was overstated 0.3%.
ANALYSIS #2: SWING STATE POLLING
What actually elects a President, however, is the popular vote from each of the 50 states (as well as the District of Columbia), and that vote (with nuances, like the Congressional district vote in Maine and Nebraska) is represented via a candidate’s slate of electors in a “winner take all” format for each state. JMC examined the state vote for each of 17 states not considered to be securely Democratic/Republican, then compared those results against polling averages for each state where polls were publicly released between October 29 and November 4.
When a similar analysis was performed in 2020, two states (Florida and North Carolina) were incorrectly “called” from an average of final week polling (in other words, the average of final week polling showed Biden ahead, when ultimately Trump won those two states). This time, two states were also “incorrectly called” from polling data, but the two states this time were Michigan and Wisconsin (in 2016, five states were “incorrectly called”: Florida, Michigan, Nevada, Pennsylvania, and Wisconsin). However, the average of national polls showed a small Harris lead, when it was Trump who won the national popular vote by nearly two percentage points.
So by this metric, the “number of correctly called states” was a bit worse than 2020 if you were to take the national popular vote into account, although it’s worth noting that the average of final week polls also “missed” Michigan and Wisconsin both in 2016 and 2024.
A more salient issue is the extent to which the average of polls consistently understated the Trump percentage relative to the Harris percentage: in all 18 jurisdictions (national + 17 states), the Trump percentage was understated, with an understatement between 1% (in Minnesota) and 5.7% (in Iowa, largely due to a last week Des Moines Register poll showing Kamala Harris LEADING in Iowa 47-44% (Iowa actually voted for Trump 56-42.5%, so this poll was off 16.5%)).
The Harris percentage was overstated in 8 jurisdictions (7 states and nationally), and was understated in 10 states between 0.2% (in Nevada) and 2.4% (in New Mexico).
Even with these under/overstatements, “polling misses” (which JMC defines as missing the Trump/Harris margin by more than 3.0%) only occurred in four states, which is a big improvement relative to 2020, when 12 states “missed the mark” by 3 or more percentage points. Given this level of improvement at the state level, it’s worth asking whether the incorporation of new polling firms since 2020 into the polling averages was the driving force behind higher quality aggregate polling data.
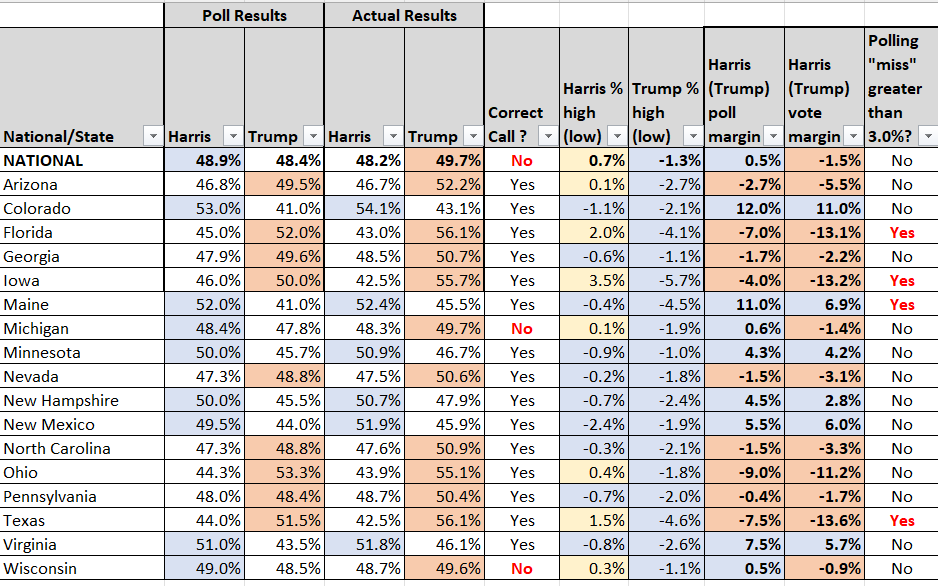
Swing state/national poll results v actual vote
CONCLUSION
While a consistent underpolling of the Trump vote has been an issue all three times he has been on the general election ballot, final week polling did somewhat improve relative to 2020.