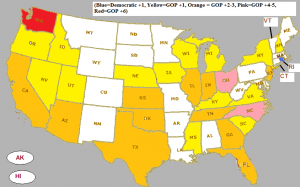
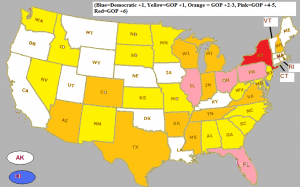
From the Republicans’ perspective, the “crown jewel” of the 2010 midterm elections was the recapture, by a significant margin, of the U.S. House of Representatives. This house of Congress has been under Democratic control since 2007, and since 1955 has been Democratic controlled for 44 of the last 56 years. Few pundits, however, have bothered to delve into the details of the GOP landslide, which offer interesting clues about what may happen in 2012.
2010/1994 comparisons
The size of the GOP landslide was nothing short of massive – a net gain of 63 seats for the Republicans, which broken down involved the GOP picking up 66 Democratic held seats while losing three of their own seats (Note: a Democratic held seat on Long Island is still undecided at press time, but the Democratic incumbent leads by 235 votes). This is the biggest midterm election gain both overall and for the Republicans since 1938. It was even larger than the 52 seat GOP gain on Election Night 1994.
So how do recent Republican gains compare to those of 1994 ? In addition to the size of the GOP landslide, the geographic distribution of the landslide differs as well. In both cases, the South and Midwest/Plains states contributed to the bulk of the GOP gains. In 1994, those two areas were the source of 34 (out of 52) new Republican seats, while in November, those two regions contributed 42 (out of 63) seats to the GOP landslide. In the Rocky Mountain states, GOP gains were also similar: a 5 seat pickup in 1994 and a 7 seat pickup in 2010. GOP gains were also minimal both times in the New England states: the GOP netted no new seats there in 1994, while in 2010, they picked up two new seats (both from anti tax New Hampshire). However, the size of both landslides differed in the Northeast and the Pacific Rim states. In 1994, the GOP only picked up three seats in the Northeast (2 from New Jersey alone), while in 2010, they picked up 12 seats (New York and Pennsylvania alone contributed 11 of these pickups). The Pacific Rim states, however, were the one bright spot for the Democrats this year. While the GOP picked up 10 seats in 1994, they didn’t net any new seats at all in 2010, as an open seat pickup in Washington state was countered by a Democratic pickup in Hawaii. Below are maps comparing those two landslide years:
The 2010 landslide in more detail
With the exception of the Pacific Rim states, the breadth of the GOP landslide was impressive. Equally impressive was the fact that of the 66 seats the Republicans picked up, 52 came from defeating incumbent Democrats (2/3 of the Democratic pickups involved defeating incumbent Republicans). When you add in the 2 Republicans and 2 Democrats who were defeated in their party primaries, you are looking at only an 85% survival rate for House incumbents seeking re-election (in the 1994 landslide, the survival rate for House incumbents seeking re-election was 90%).
Further examination of the election results reveal a stunning rebuke of House Democrats, and do not offer much hope of their retaking the House in 2012. The conventional wisdom was that the landslide decimated those Democrats elected in the landslide years of 2006 and 2008. However, of those 78 Democrats elected who sought re-election, only 36 were defeated, and in those districts, the Presidential vote was 50-49% for McCain (Obama was elected with 53% of the vote in 2008). This basically means that these defeated junior Democrats came from Republican leaning districts that merely reverted back to their normal partisan leanings. Absent popular disgust at the performance of House Republicans – or the presence of strong Democratic challengers – it’s hard to see the Democrats winning these seats back any time soon.
The GOP landslide didn’t just claim the careers of junior Democrats, however. The real surprise of the night was the defeat of 11 supposedly entrenched Democrats elected between 1974 and 2000 whose districts supported John McCain 54-45.% Similarly, an additional group of 5 incumbent Democrats with 6-8 years of seniority was defeated, and in those districts, the Presidential vote was 53-45% for McCain. The remainder of the GOP landslide came from 14 open Democratic seats, where the Presidential vote was 51-47% McCain. And while the Republicans did lose three seats to the Democrats, the average Presidential vote there was 69-29% for Obama. All in all, the composition of the landslide means that GOP gains came from Republican leaning districts, while Republican defeats came exclusively from solidly Democratic areas. It’s hard to see how Democrats can take these Republican leaning districts back.
While an examination of the components of the landslide doesn’t offer much hope for Democrats in the near future, there is the prospect of additional GOP gains in 2012 if one looks at “the ones who got away.” We looked at an additional 103 Democratic held House seats that were at least marginally competitive, and in 42 of these seats, a Democrat was elected/re-elected with less than 55% of the vote, while Obama carried these districts 56-43%. Unless President Obama’s electoral fortunes improve in 2012, it’s not hard to fathom a few additional GOP pickups from these districts, since these Democratic House candidates ran BEHIND the 2008 Democratic Presidential vote. And we’re assuming here that all of these Democrats will seek re-election in 2012.
In addition to the realities that (1) Democrats lost seats in Republican leaning areas, (2) 42 of the 193 seats they still hold were won by narrow margins, redistricting and age offer further challenges to House Democrats. Of the survivors, 14 will be at least 70 years old in 2012. When you combine this with the prospect of life in the minority for the foreseeable future (Democrats must pick up a net of 25 seats to retake the House), it’s possible that several of these older Democrats will decide to retire, particularly if they live in states (Indiana, Michigan, North Carolina, Ohio, Pennsylvania, and Wisconsin, to name a few) where the GOP will likely have total control of redistricting. There is a precedent for “life in the minority” factoring into retirement decisions: after the 1994 GOP landslide, 37 Democrats decided to retire. After the 2006 Democratic landslide, 31 Republicans retired.
2012 implications
Do the 2010 midterms have any 2012 implications? At a minimum, the states which voted for McCain in 2008 are very unlikely to switch to Obama in 2012. States in the interior of the country (particularly those in the Midwest) which voted for Obama in 2008 are very shaky right now for the President. However, the fact that the GOP landslide was barely perceptible in the West Coast suggests that the President can still count on California, Washington, Oregon, and Hawaii, and he has an even shot at keeping Colorado and Nevada in his corner as well. On the Atlantic Coast, Obama can probably count on holding the New England states, except for New Hampshire and (possibly) Maine. He can also count on New York, Delaware, and Maryland, although Pennsylvania and New Jersey are question marks at this point.
Once the dust settles after the new Congress is inagurated, we will have a new “Obama plunge” (explained here) analysis available for us to assess which House/Senate races are likely to be competitive in 2012.


[…] Continue reading at http://new.winwithjmc.com/archives/2086 […]
2010 Midterm results: Part 6 – US House races – JMC Enterprises of ……
Here at World Spinner we are debating the same thing……
Recommeneded websites…
[…]Here are some of the sites we recommend for our visitors[…]……
Sites we Like……
[…] Every once in a while we choose blogs that we read. Listed below are the latest sites that we choose […]……
Superb website…
[…]always a big fan of linking to bloggers that I love but don’t get a lot of link love from[…]……
Check this out…
[…] that is the end of this article. Here you’ll find some sites that we think you’ll appreciate, just click the links over[…]……
Visitor recommendations…
[…]one of our visitors recently recommended the following website[…]……
Websites you should visit…
[…]below you’ll find the link to some sites that we think you should visit[…]……
Sources…
[…]check below, are some totally unrelated websites to ours, however, they are most trustworthy sources that we use[…]……