Now that the 2016 Presidential election cycle has concluded, there has been considerable discussion about whether pollsters as a whole “missed the boat” on predicting the Presidential race. Did they ?
To evaluate, there are two aspects of the 2016 Presidential polls that JMC Analytics and Polling analyzed: (1) how well the polls predicted the national popular vote, and (2) how well the polls predicted the vote in each of the swing states. In performing this analysis, JMC used both certified election results and publicly released polls during the final seven days before Election Day. Undecided voters were removed from this analysis.
ANALYSIS #1: NATIONAL POLLING
While the national popular vote (thanks to the Electoral College) does not truly matter in the election of a President, national polls are nevertheless a frequently used metric to evaluate how a Presidential campaign is progressing. Using national polling as a way to evaluate pollster performance, pollsters got the election almost exactly right: the average of polls taken between November 1-8 showed Hillary Clinton with a 47.5-45.7 (or a 1.8 percentage point) lead over Donald Trump. Since the national popular vote was actually won 48-46% by Clinton, this 2.0 percentage point margin of victory understated the Clinton popular vote margin by a mere 0.2 percentage points.
ANALYSIS #2: SWING STATE POLLING
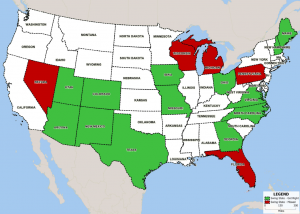
Since it is the vote of each of the 50 states that really elects a President, this analysis also examined polls conducted in the so called “swing states” between November 1-8. JMC defines a “swing state” as one that was not considered a secure lock for either Presidential candidate during the 2016 cycle, and using that criteria, 19 states qualified, although the lack of publicly released polling from Minnesota in the last week of the campaign means that the scope of this analysis can only consider 18 of those 19 states.
The first evaluation assesses whether the average of publicly released polls correctly predicted the eventual winner for each swing state. Using that criteria, pollsters’ performance as a whole was mediocre: only 13 of the 18 states (or 72%) were correctly called by the aggregate of polling data – “polling misses” were in Florida, Michigan, Nevada, Pennsylvania, and Wisconsin.
The second evaluation at the statewide level assesses the extent that pollsters missed the mark on swing state polling. This analysis revealed a considerable amount of variation of “miss” between each of the swing states: at one extreme, the Trump margin was understated by 7.2% in Wisconsin (this in addition to the fact that pollsters incorrectly predicted a Clinton win there), while in New Hampshire, his margin was understated by 0.3%. Overall, in 11 of the 18 “swing states”, polls missed their mark by more than 3% (a margin of error JMC sees as appropriate for state level polls). These “major misses” also included four of the five states that polls incorrectly called in the previous analysis.
CONCLUSION
In the contests that mattered (i.e, the state by state races that determine who is elected President), polling in the last week of the Presidential campaign in quite a few swing states was off by more than 3%, while national polling (which gets reported often, but is a meaningless number) conducted was very accurate.


