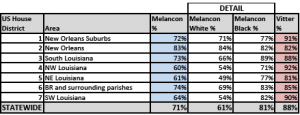
To provide the most complete picture of Louisiana’s U.S. Senate primary, we wanted to do some more analysis of the vote both at a statewide and a Congressional District level.
In David Vitter’s case, there were three Congressional districts where he ran significantly above or below his statewide average of 88%: in the New Orleans suburbs he represented for three terms (and represented for two terms in the state House before that), he received a near unanimous 92% of the vote. His weakest showing was in the 5th Congressional district, where he got 81% – a showing that can easily be explained by the fact that Chet Traylor is from this area, and he had name recognition from the time he was on the Supreme Court. In the 2nd Congressional district (New Orleans and parts of the Westbank), he received 82%, while he got 85% in the 6th Congressional district (Baton Rouge and surrounding suburban/rural areas). Since these percentages represent the level of support from the most highly informed, partisan, and motivated Republicans who voted in this primary, we believe that (as was mentioned in a prior posting) “…Vitter will suffer a little erosion in his support in more urban white neighborhoods in East Baton Rouge and Orleans Parish…”
The Democratic primary vote showed substantially more variation and therefore was where we concentrated the bulk of our analysis. Statewide, Charlie Melancon received 71% of the Democratic/Independent vote, with 81% of the black vote and 61% of the white vote. This variation is hardly a ringing endorsement for someone who’s been in the race for over a year while facing two unknown opponents.
While the black vote went solidly for Melancon, there was some variation, depending on the part of the state. He received a near unanimous 89% of the black vote in his own 3rd Congressional district. In the 2nd, 6th, and 7th Congressional districts, he received 82-83% of the vote. However, he received an anemic 71% of the black vote in northwest Louisiana, while in the New Orleans suburbs and northeast Louisiana, he got 77%,
We had discussed Melancon’s weakness with white primary voters in a prior post. Keep in mind that in a closed primary where the Congressional races were the only item on the ballot, the most politically aware people were those who showed up to vote (the Democratic/Independent turnout was 5%). And with that set of voters, Melancon’s percentages significantly varied.
In the metropolitan areas (where the Democrats/Independents tend to be more “Garden District liberals”) Melancon scored his best percentages in the state. He received 84% of the white vote in the 2nd district, 71% in the 1st district , and 69% in the 6th district. Surprisingly, his 66% of the white vote with Democrats/Independents in his own 3rd Congressional district was only the 4th best showing out of seven Congressional districts and suggests that the drilling moratorium (and Melancon’s “response” to it) is hurting his electoral standing in one of the most oil and gas heavy districts in the country.
Once you leave the urban areas and cross the “cypress curtain” (explained here), Melancon’s support with party activists/chronic voters plunges. In northwest and southwest Louisiana, he received 54% of the white vote, and he received a very mediocre 49% of the white vote in the 4th Congressional district.
As a final thought, if we were to look only at the primary vote Vitter and Melancon received (in other words, we’re excluding the votes of the “also rans”), Vitter received 52% of the vote cast in August, which is pretty impressive when you consider that only 26% of the statewide electorate is registered Republican. Even more impressive is the breadth of his vote: he carried six out of the seven Congressional districts, with an impressive 57% of the vote in Melancon’s own Congressional district and an even more impressive 69% of the vote in the Congressional district he represented for two terms.


[…] JMC Enterprises » Final Thoughts on the U.S. Senate Primary […]
[…] This post was mentioned on Twitter by Sammye Delcambre, Charles. Charles said: JMC Enterprises » Final Thoughts on the U.S. Senate Primary: JMC Enterprises – It's Election Day… do you know wher… http://bit.ly/cmTCNt […]
Check this out…
[…] that is the end of this article. Here you’ll find some sites that we think you’ll appreciate, just click the links over[…]……
Sites we Like……
[…] Every once in a while we choose blogs that we read. Listed below are the latest sites that we choose […]……
Read was interesting, stay in touch……
[…]please visit the sites we follow, including this one, as it represents our picks from the web[…]……
Recent Blogroll Additions……
[…]usually posts some very interesting stuff like this. If you’re new to this site[…]……
Related…
[…]just beneath, are numerous totally not related sites to ours, however, they are surely worth going over[…]…