Introduction
While the departure of Joe Biden from the Presidential contest has been the latest “campaign shocker”, has the Presidential race fundamentally changed ? Today, JMC will purely focus on applicable polling to evaluate the answer to this question. In the short term, the Presidential contest is about to take “second stage” to the Olympic contests underway in Paris, but will be front and center again once the Democrats meet on August 19 in Chicago to choose its nominee, who almost certainly will be Vice-President Kamala Harris.
It’s also worth noting that after a month-long “drought”, primary season (for Congressional, state, legislative, and local races) has returned for the 19 states that have yet to hold primaries for Congressional and/or legislative races. Arizona’s primary is on Tuesday July 30, which will then be followed by a “primary-a-thon” lasting until September (Louisiana’s primary coincides with the Federal Election Day of November 5).
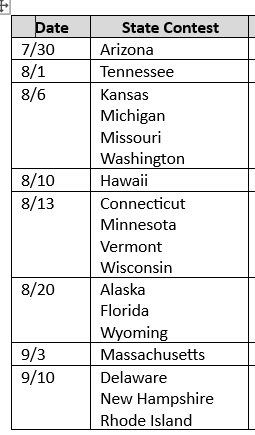
August-September primary calendar
Presidential polling
When discussing polling in a Presidential contest, it’s important to understand that there are two atmospheric challenges the party in power/its apparent nominee Kamala Harris faces: (1) underwater approval ratings (43-55% approve/disapprove) for President Biden according to a weighted average of the last seven days’ of polling data which JMC has compiled, and (2) an initial unfavorable impression for Harris which, according to 538, is 38-52% approval/disapproval.
These atmospherics are a counterweight to a smoothly executed rollout of the Harris campaign, considering that Joe Biden’s abrupt withdrawal from the race six days ago required that Kamala rapidly jumpstart a Presidential campaign. In other words, despite overwhelmingly positive media coverage, the polls have barely changed – less than a point of Trump’s existing poll lead has been shaved off during this “honeymoon period” for her campaign.
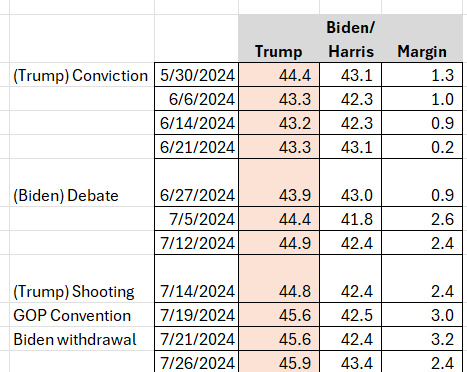
Weekly polling averages
Underpinning this lack of movement is the reality that with fairly solid polarization of the American electorate, “big events” (Trump’s conviction, Biden’s debate performance, the attempted assassination of Donald Trump, and now the substitution of Joe Biden for Kamala Harris as a result of the Biden withdrawal) aren’t moving the needle very much, which strongly suggests that the vast majority (likely in the 95-97% range) of the electorate has already decided on a Presidential candidate, and there are few swing voters to be had/found.
This inelasticity of the electorate needs to be discussed in tandem with the actual mechanics of electing a President. While the national polls are interesting from the standpoint of spotting trends, it’s the Electoral College that actually elects a president. And given the inefficient vote distribution of Democratic and Republican votes, it’s possible for a Republican to be elected President without attaining a popular vote majority (or even a plurality). In other words, California and New York have in recent election cycles generated larger Democratic vote margins than Florida and Texas have for Republicans.
National popular vote vs the Electoral College
Even though Joe Biden was elected in 2020 with a 4.5% popular vote margin (51.3-46.8% over Donald Trump) and a 303-235 lead in the Electoral College using applicable numbers for the 2024 Presidential election (270 electoral votes are needed to win), Biden’s Electoral College victory was built on narrow victories in several states, like Arizona, Georgia, Michigan, Nevada, Pennsylvania, and Wisconsin.
From that baseline of a 4.5% national popular vote win, we can then assess the extent to which shifts in the national popular vote can flip specific states. To be conservative in his analysis, JMC is assuming that only half of a national popular vote shift would occur in a swing state, since those states (which get an oversized amount of attention from either side) tend to be less elastic in their movement towards a candidate.
Even with this conservative analysis, any movement towards Trump relative to a 4.5% national popular vote deficit would still have an electoral impact. For example, even a Harris national popular vote win of 3.5% (a shift of 1% towards Trump, in other words) would flip Arizona and Georgia, which would then put Trump up to 262 electoral votes (8 electoral votes shy of a victory, in other words), while a Harris win of 2.5% (a 2% shift towards Trump relative to 2020) would also flip Wisconsin and get Trump to the necessary 270 electoral votes.
The last seven days of national polling (even with Harris narrowing the margin) shows an average poll lead for Trump of 1.9% (he’s up 46.4-44.5% over Harris), which would translate to 312 electoral votes for Trump. In other words, a 1.9% Trump lead is a 6.4% swing to Trump relative to his 2020 popular vote loss, and a swing of that volume (even accounting for swing states’ being less elastic) would flip Arizona, Georgia, Michigan, Nevada, Pennsylvania, and Wisconsin. Below is a representation of the electoral college impact of various national popular vote possibilities.
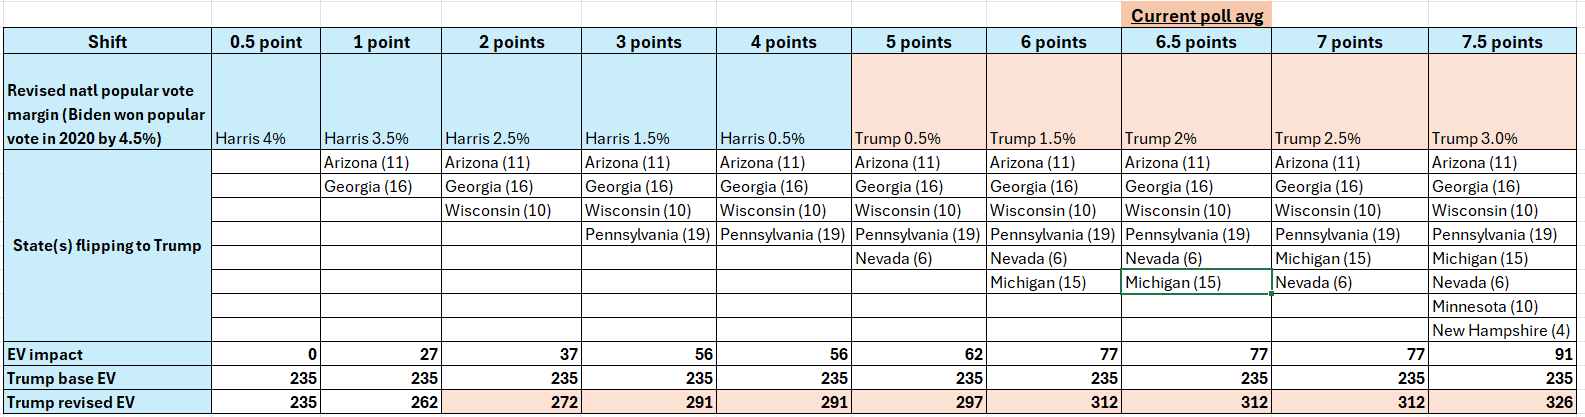
National popular vote/Electoral College shifts
Conclusion
Kamala Harris (as this article is being written, the assumption is that she will be the Democratic nominee) has her work cut out for her, and this posting was meant as a visual illustration of how national polling numbers would translate to various Electoral College vote possibilities.