Now that Labor Day has passed, political season has truly begun. And ever since January, JMC has been continuously analyzing political data to make a proper assessment of this year’s political climate. And with only the Louisiana primary (November 6 primary/December 8 runoff) remaining, this would be a good time to revisit the “state of the midterms” using the following two metrics:
- Voter registration changes
- Partisan enthusiasm during primary season
Metric #1: Voter registration changes
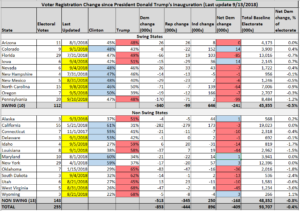
Theoretically, if voters were in a strong partisan mood, that mood would be picked up by changes in partisan voter registration in states that require that its voters choose a party when he/she registers to vote. Therefore, JMC has been tracking changes in party registration since January 20, 2017 (i.e., the date President Trump was inaugurated). From an examination of the available data, JMC has continuously seen no discernible evidence (from a party registration perspective) of a Democratic wave. More specifically, since January 2017, there are 853K less Democratic voters, 444K less Republican voters, but 896K MORE unaffiliated/third party/Independent voters over a denominator of 94 million registered voters in 23 states. Furthermore, from looking at these changes periodically over time, this Independent/3rd party “advantage” has only grown over time.
Metric #2: Partisan Enthusiasm
Because midterm election turnout is always lower than it is in Presidential election years, the concept of base/partisan enthusiasm (especially in close races) takes on an enhanced level of importance. JMC believes that partisan enthusiasm is something that can be measured early on during primary season (provided that partisan turnout can be measured for both parties at the statewide level) as a “distant early warning” before the November balloting.
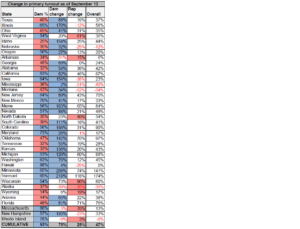
Now that primary season is (with the exception of Louisiana) over, partisan enthusiasm can be measured in 38 states, and in those states, 55% voted in the Republican primary in 2014, with 24.7 million overall primary turnout. This year in those same states, 53% have voted in the Democratic primary, with 36.3 million overall primary turnout. In other words, Democratic turnout increased 75% relative to the 2014 primaries, while Republican turnout increased 25% – overall primary turnout is 47% higher than it was in 2014. There are those of a partisan bent who may dismiss this year’s primary turnout as being indicative of an impending Democratic wave, so JMC also examined midterm primary voting data for the 2006 and 2010 midterm cycles, and found that in 2006 (a Democratic “wave year”), 54% voted Democratic, while 56% voted Republican in 2010 (which was a Republican “wave year.”).
Conclusion
There is a seeming contradiction between the voter registration figures and actual partisan primary turnout. JMC believes that this contradiction can be explained by a simple “law of political physics”: in a midterm election, the party out of power typically has the advantage of greater enthusiasm. This year, that enthusiasm advantage is heavily tilted towards the Democrats. And that enthusiasm so far indicates partisan gains of the magnitude of 2006 or 2008.


