Introduction
Election season is now upon us, even though the official “start date” is considered to be Labor Day. Only five states still have to hold their primaries: Delaware, Louisiana, Massachusetts, New Hampshire, and Rhode Island. One of them (Massachusetts) votes the day after Labor Day, while three more states vote on September 10, then the Louisiana primary (the final one) coincides with the Federal Election Day of November 5.
With the general election campaign underway, what has been going on (from a polling perspective) with the Presidential race?
Presidential Polling
When discussing polling for the 2024 Presidential contest, there are two atmospheric challenges that the party in power/its official nominee Kamala Harris faces: (1) while her approval ratings have improved since the Biden withdrawal from the race, they still remain “underwater” (her 47-46% approval/disapproval according to 538 is relatively unchanged since last week), and (2) persistent high disapproval (43-55% approval/disapproval according to a 7 day average of polls taken, which is unchanged since last week) of the Biden administration. Since Kamala Harris is Joe Biden’s Vice-President, that persistent disapproval remains a negative weight on her campaign.
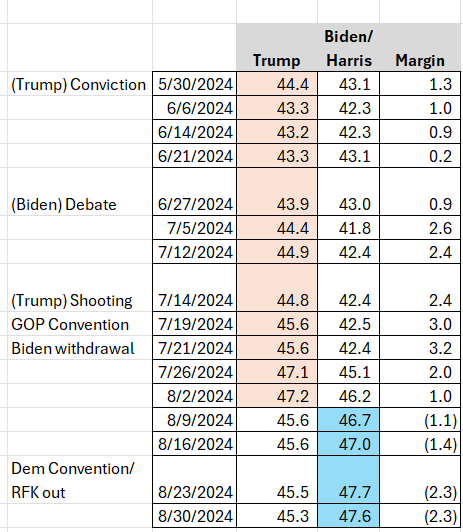
Joe Biden’s withdrawal enabled the Harris campaign to “reset” the race which, when combined with impolitic remarks from both the Presidential and Vice Presidential Republican nominees and an error-free Democratic convention enabled her to amass a lead. However, that lead is insubstantial, and for the first time since July it has remained essentially unchanged relative to the previous week – a 7 day average of national polling data as of this morning shows that the 2.3% lead for the Harris-Walz ticket a week ago has not changed this week. Incidentally (to put that lead in its proper historical perspective), RealClearPolitics notes that at this point in time, Biden in 2020 was ahead of Trump by 6.9%, while Hillary Clinton was up 5% over Trump in 2016.
From a numerical/trend perspective, that means that a 3.2% Trump poll lead six weeks ago has moved 5.5% “to the left” to a 2.3% poll deficit. Despite conventional wisdom telling us that there would be a “convention bounce” benefitting Kamala Harris, the race hasn’t changed due to basic political physics: (1) existing polarization in the American electorate allows for little room for partisan movement either way, and (2) political conventions aren’t news events like they once were, so any changeable voters probably weren’t watching the convention to begin with.
Below is a representation of the weekly changes in the national poll averages since late May:
Weekly polling averages
Weekly Polling Averages
When discussing the news value of polls taken at a national level, it’s important (in terms of putting national polling numbers in their proper context) to realize that the Electoral College (and not the national popular vote) actually elects a President. That technical distinction marginally benefit the Republicans. In other words, because of an inefficient vote distribution of Democratic and Republican votes across the 50 states, it’s possible for a Republican to be elected President without attaining a popular vote majority (or even a plurality), because California and New York have in recent election cycles generated larger Democratic vote margins than Florida and Texas have for Republicans. And while those large margins in California/New York run up the score from a national popular vote perspective, “running up the score” doesn’t get a Democratic candidate any closer to the needed 270 electoral votes.
National popular vote vs the Electoral College
To illustrate the disconnect between the Electoral College and the national popular vote, Joe Biden was elected in 2020 with a 4.5% popular vote margin (51.3-46.8%) over Donald Trump. He also “won” the Electoral College 303-235 using applicable numbers for the 2024 Presidential election (270 electoral votes are needed to win), Biden’s Electoral College victory was due to narrow victories in several states, like Arizona, Georgia, Michigan, Nevada, Pennsylvania, and Wisconsin.
From that starting point of a 4.5% national popular vote win, we can assess the extent to which shifts in the national popular vote towards Trump could flip specific swing states, as national shifts can and will have an impact in both swing and non-swing states. To be conservative in his analysis, JMC is assuming that only half of a national popular vote shift (percentage-wise) would occur in a swing state, since those states (which get an oversized amount of attention from either side) tend to be less elastic in their movement towards a candidate.
Still, even with this conservative analysis, any movement towards Trump relative to a 4.5% national popular vote deficit would “flip” states to Trump that narrowly voted for Biden in 2020. For example, even a Kamala Harris national popular vote win of 3.5% (a shift of only 1% towards Trump, in other words) would flip Arizona and Georgia, and those two flips alone would get Trump up to 262 electoral votes – 8 electoral votes shy of a victory. A Harris win of 2.5% (a 2% shift towards Trump relative to 2020) would also flip Wisconsin and get Trump to the necessary 270 electoral votes.
To translate that theory into “real world” terms, the last seven days of national polling show an average lead for Kamala Harris of 2.3% (she’s up 47.6-45.3% over Trump), which would translate to 272 electoral votes for Trump. In other words, a 2.3% Harris lead equals a 2.2% swing to Trump relative to his 2020 popular vote loss. A swing of that magnitude (even accounting for swing states’ being less elastic than the rest of the country) would flip Arizona, Georgia, and Wisconsin and give Trump the electoral votes he needs to win. Below is a representation of the electoral college impact of various national popular vote possibilities.
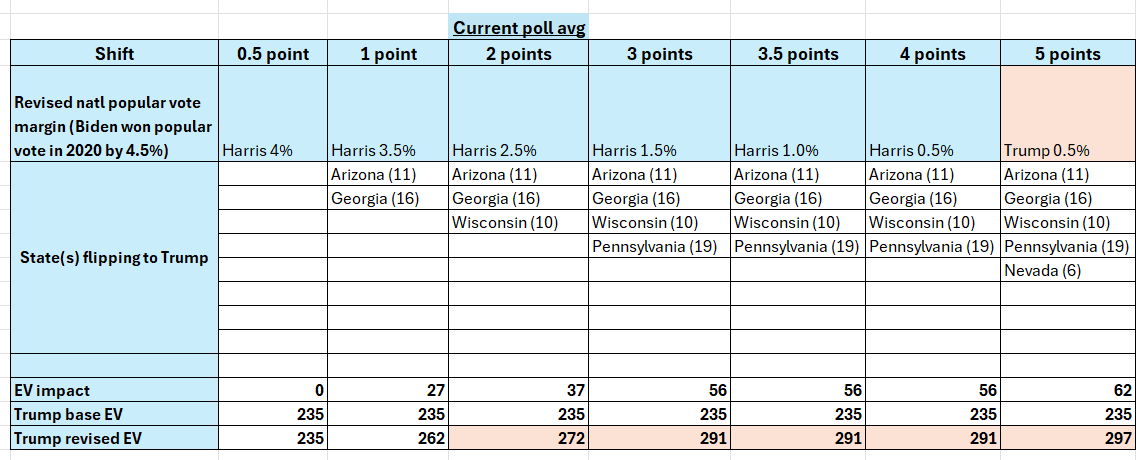
National popular vote shifts v the Electoral College
The early vote
While technically Election Day is November 5, an increasing number of voters are choosing to vote before that. Research done shows that 45% voted early in 2016, and that number surged to 69% in 2020. While the pandemic/mass adoption of mail voting certainly contributed to the increase in early voting in 2020, the reality is, Election Day voting has nevertheless become a thing of the past for an increasing number of people, which DOES impact the timing of when campaigns need to disseminate their messaging to voters.
In practical terms, “Election Day” actually begins when North Carolina sends out mail ballots on September 6. It then shifts into overdrive on September 20 when Minnesota, South Dakota, and Virginia become the first states to start in person early voting. More states will join in as we advance through the election calendar, and by October 8, states constituting a majority of the Electoral College will have their “Election Days” underway. Below is a calendar of the first month of early voting:
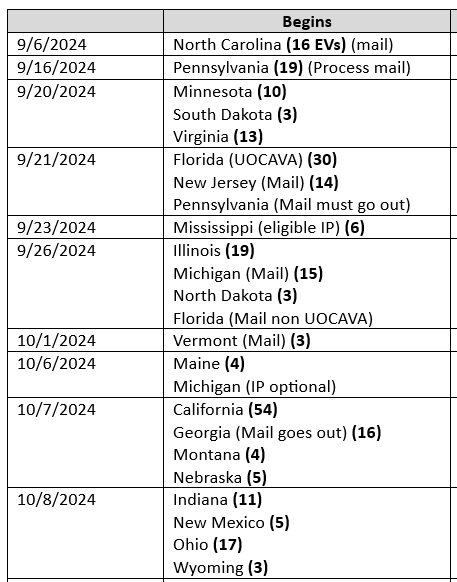
Early voting schedule (partial)
Conclusion
Even though the Republicans have not had a favorable last six weeks, existing polarization of the electorate, combined with scrutiny over the Harris/Walz ticket, has created a state of equilibrium with the Presidential campaign. That makes the September 10 debate between Harris and Trump all the more critical as the campaign clock is ticking: in 7 days, mail ballots go out in North Carolina, while in person early voting commences on September 20 in Minnesota, South Dakota, and Virginia.
What this means in practical terms is that the peak of campaign season (in terms of reaching the maximum number of movable voters) will be the month of September, because states will be steadily ramping up their early voting throughout October, and by then, those who have voted become irrelevant to either campaign from either a persuasion or a turnout perspective.