Introduction
We are in the midst of election season now; in fact, people are already voting in 24 states – that we know about, and the Vice Presidential debate between Tim Walz and JD Vance is scheduled for Tuesday.
Given that the general election campaign (and “early voting season”) is underway, what has been going on (from a polling perspective) with the Presidential race?
Presidential Polling
When discussing polling for the 2024 Presidential contest, the main challenge for the party in power/Democratic nominee Kamala Harris is that the Biden Administration remains unpopular (43-54.5% approval/disapproval according to a 7 day average of polls taken, which is a slight uptick from 42-56% last week). Since Kamala Harris is Joe Biden’s Vice-President, that obvious association with an unpopular President remains a negative weight on her campaign.
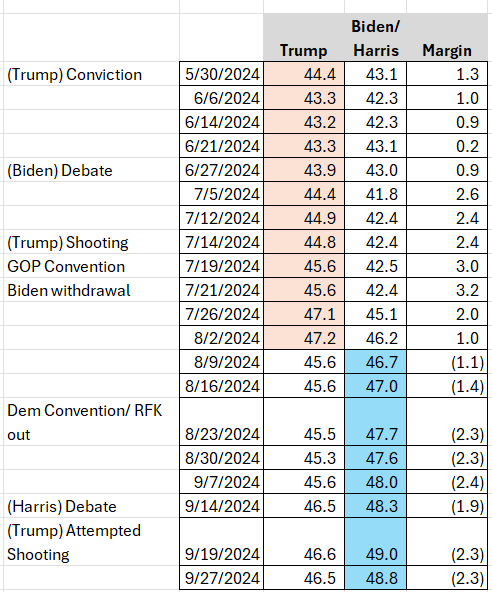
What has been characteristic of this election cycle is that supposed “big events” generally haven’t moved the needle much. Which means that for the last month, there has been an “equilibrium” of a national popular vote lead of 2-2.5% for Kamala Harris (which, incidentally, was the popular vote spread for the same 2016 Presidential election that initially elected Donald Trump).
So despite the dictates of conventional wisdom, only two events have materially benefitted Kamala Harris’ campaign: (1) Biden’s withdrawal on July 21 and, (2) to a lesser extent, Kamala’s debate performance on September 10. Currently, a 7 day average of national polling shows Harris up 2.3% (48.8-46.5%) over Donald Trump. This is the same spread as last week. To put this 2.3% lead in proper perspective, though, RealClearPolitics notes that at this point in time, Biden in 2020 was ahead of Trump by 6.8%, while Hillary Clinton was up 3.0% over Trump in 2016.
From a numerical/trend perspective, that means that a 3.2% Trump poll lead 10 weeks ago shifted 5.5% “to the left” to a 2.3% poll deficit. And the lack of any trend since then is because polarization in the American electorate limits partisan movement in either direction.
Below is a representation of the weekly changes in the national poll averages since late May:
Weekly Polling Averages
National popular vote vs the Electoral College
When discussing the news value of polls taken at a national level, it’s important (to put those polling numbers in proper context) to realize that the Electoral College (and not the national popular vote) actually elects a President, and that marginally benefits Republicans because of an inefficient vote distribution of Democratic and Republican votes across the each state. In other words, a Republican can be elected President without attaining a popular vote majority (or even a plurality), because California and New York have in recent election cycles generated larger Democratic vote margins than Florida and Texas have for Republicans. And while large margins in California/New York “run up the (national popular vote) score”, “running up the score” doesn’t get a Democratic candidate any closer to the needed 270 electoral votes without winning critical swing states.
To illustrate the disconnect between the Electoral College and the national popular vote, Joe Biden was elected in 2020 with a 4.5% popular vote margin (51.3-46.8%) over Donald Trump, but his victory was (using applicable 2024 numbers) a 303-235 Electoral College win (270 electoral votes are needed to win), Biden’s Electoral College victory was due to narrow victories in several states, like Arizona, Georgia, Michigan, Nevada, Pennsylvania, and Wisconsin.
From that starting point of a 4.5% national popular vote win, we can assess the extent to which shifts in the national popular vote towards Trump could flip specific swing states, as national shifts have an impact in both swing and non-swing states. To be conservative in his analysis, JMC is assuming that only half of a national popular vote shift (percentage-wise) occurs in a swing state, since those states (which get an oversized amount of attention from either side) are less elastic in their movement towards a candidate.
Even with this conservative analysis, any movement towards Trump relative to a 4.5% national popular vote deficit would “flip” states to Trump that narrowly voted for Biden in 2020. Even a Kamala Harris national popular vote win of 3.5% (a shift of only 1% towards Trump, in other words) would flip Arizona and Georgia, and those two flips alone would get Trump up to 262 electoral votes – 8 electoral votes shy of a victory. A Harris win of 2.5% (a 2% shift towards Trump relative to 2020) would then flip Wisconsin and get Trump to the necessary 270 electoral votes.
Let’s translate that theory into “real world” terms. The last seven days of national polling show an average lead for Kamala Harris of 2.3% (she’s up 48.8-46.5% over Trump), which would translate to 272 electoral votes for Trump. In other words, a 2.3% Harris lead equals a 2.2% swing to Trump relative to his 2020 popular vote loss. A swing of that magnitude (even accounting for swing states’ inelasticity relative to the rest of the country) would flip Arizona, Georgia, and Wisconsin and give Trump the electoral votes he needs to win. Below is a representation of the electoral college impact of various national popular vote possibilities.
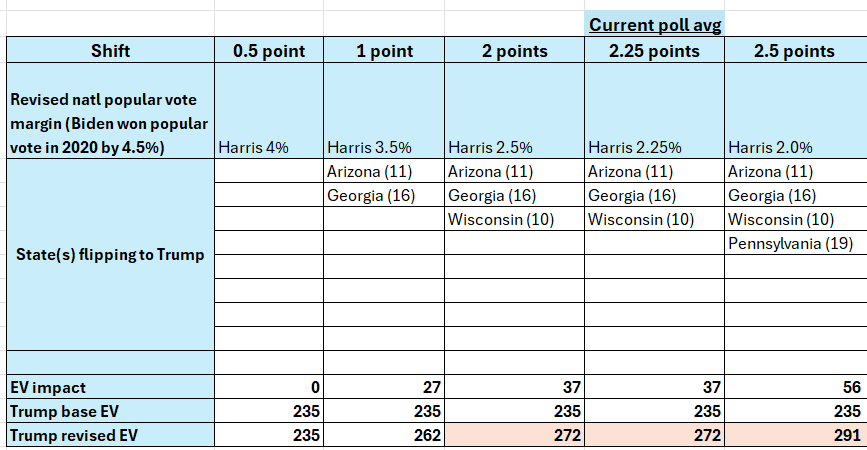
National popular vote shifts v the Electoral College
There is one more aspect to polling that needs to be discussed: quantifying polling error in swing states from previous elections, as those errors both in 2016 and 2020 almost without exception understated the Trump vote. If we were to examine how far the average of last week polls were “off”, and factor that error into the average of current polling over the last 7 days, what we find is that Trump can (based on current polling) flip Arizona, Georgia, Michigan, Pennsylvania, and Wisconsin. That would get him (under this hypothetical example, polling accuracy is assumed not to have improved since 2016/2020) 306 electoral votes.

Calculated “flips” from 7 day average of polls and 2016/2020 polling “misses”
The early vote
While technically Election Day is November 5, an increasing number of voters are choosing to vote before that. Research done shows that 45% voted early in 2016, and that number surged to 69% in 2020. While the pandemic/mass adoption of mail voting certainly contributed to the increase in early voting in 2020, the reality is, Election Day voting is nevertheless becoming a thing of the past for an increasing number of people, which DOES impact the timing of when campaigns need to disseminate their messaging to voters.
Several swingy states (Florida, North Carolina, Michigan, Pennsylvania, and Wisconsin) have already sent out mail in ballots, while Illinois, Virginia, and New Jersey have sent mail ballots as well. And while in person early voting has also begun, the only swingy states where it’s in progress are Minnesota and Virginia (Illinois, North Dakota, and South Dakota have begun in person early voting as well). Below is a calendar of the next 30 days of early voting:
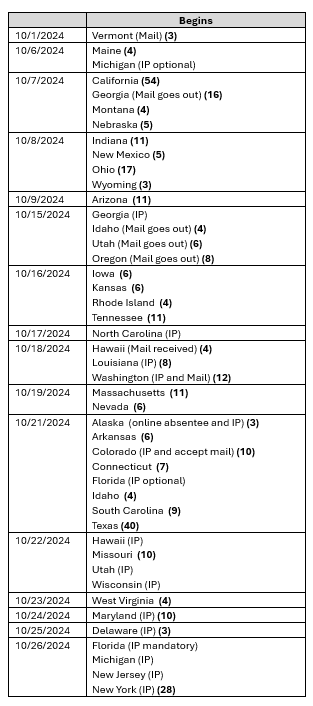
Early voting calendar to 10/28/2024
Early Voting Data
Currently, we have data on mail ballot requests in 32 states, and currently, 51.1 million (up from 47.9M a week ago) have already requested a mail in ballot. Furthermore, 402,245 in 24 states have already voted either by mail or in person (compared to 1,009 a week ago). These figures will skyrocket with each passing week, especially since in person early voting has begin.
Conclusion
Even though the Republicans have not retaken the lead in the national popular vote since the Biden withdrawal, polling numbers have stabilized with a Harris lead small enough to make it possible for Donald Trump to amass 270 electoral votes.
Meanwhile, early voting continues to accelerate, which means in practical terms that the peak of campaign season (in terms of reaching the maximum number of movable voters) will actually be over the next two weeks, because states will be steadily ramping up their early voting throughout October, and by then, those who have voted become irrelevant to either campaign from either a persuasion or a turnout perspective.