Introduction
We are in the midst of election season (in fact, Election Day votes have already been cast in three states), and all but Louisiana have now held their primaries (Louisiana’s primary is held at the same time as the federal election day of November 5).
With the general election campaign (and “early voting season” underway), what has been going on (from a polling perspective) with the Presidential race?
Presidential Polling
When discussing polling for the 2024 Presidential contest, the main challenge that the party in power/Democratic nominee Kamala Harris faces is the fact that the Biden Administration remains unpopular (43-56% approval/disapproval according to a 7 day average of polls taken, which is a downgrade from 43-54% last week). Since Kamala Harris is Joe Biden’s Vice-President, that instant association with an unpopular President remains a negative weight on her campaign.
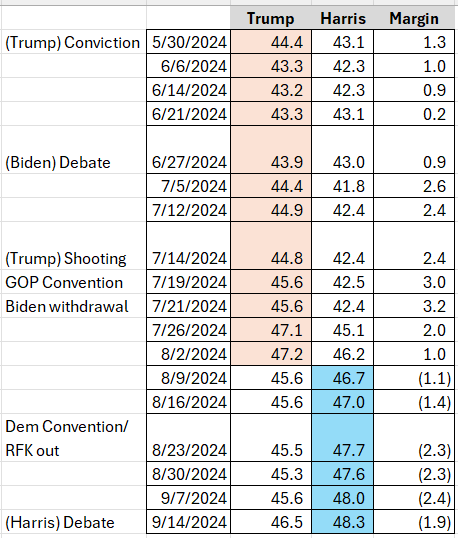
There has been a “back and forth” aspect to this campaign, despite the fact that you don’t have substantial (i.e, double digit) shifts in either candidate’s polling. The Democrats have benefitted from both the Biden withdrawal on July 21 and Kamala’s debate performance on September 10 (which, as will soon be shown, has helped her standing), while outside of those two “game changing” events, an equilibrium had been reached on the race. Immediately before the debate, polls JMC collected showed that Trump had a average lead of 0.3 (or a 48-47.7% lead). Since the debate, limited polling available shows that Harris has a 3 point (48.8-45.8%) lead.
Overall, in the previous 7 day period, Harris had a 2.4% lead, and with both pre and post debate polls included in the current 7 day lookback period, Harris a 1.9% (48.3-46.5%) lead. Incidentally (to put that lead in its proper historical perspective), RealClearPolitics notes that at this point in time, Biden in 2020 was ahead of Trump by 7.1%, while Hillary Clinton was up 2.3% over Trump in 2016.
From a numerical/trend perspective, that means that a 3.2% Trump poll lead eight weeks ago has shifted 5.1% “to the left” to a 1.9% poll deficit. While polls taken in the immediate aftermath of the convention show that Harris has had a 3.3% bounce, it’s best to wait until late next week to gauge the full impact, because ultimately two forces are keeping the race stable: (1) polarization in the American electorate allows for little room for partisan movement in either direction, and (2) short term spikes are not having lasting impacts.
Below is a representation of the weekly changes in the national poll averages since late May:
Weekly polling averages
Weekly Polling Averages
When discussing the news value of polls taken at a national level, it’s important (in terms of putting national polling numbers in their proper context) to realize that it’s the Electoral College (and not the national popular vote) that actually elects a President, and that marginally benefits the Republicans. In other words, because of an inefficient vote distribution of Democratic and Republican votes across the each state, it’s possible for a Republican to be elected President without attaining a popular vote majority (or even a plurality), because California and New York have in recent election cycles generated larger Democratic vote margins than Florida and Texas have for Republicans. And while large margins in California/New York can “run up the national popular vote score”, “running up the score” doesn’t get a Democratic candidate any closer to the needed 270 electoral votes without winning critical swing states.
National popular vote vs the Electoral College
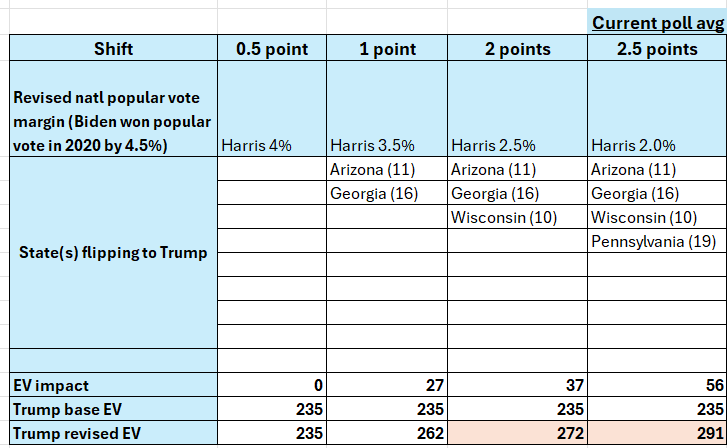
To illustrate the disconnect between the Electoral College and the national popular vote, Joe Biden was elected in 2020 with a 4.5% popular vote margin (51.3-46.8%) over Donald Trump. He also “won” the Electoral College 303-235 using applicable numbers for the 2024 Presidential election (270 electoral votes are needed to win), Biden’s Electoral College victory was due to narrow victories in several states, like Arizona, Georgia, Michigan, Nevada, Pennsylvania, and Wisconsin.
From that starting point of a 4.5% national popular vote win, we can assess the extent to which shifts in the national popular vote towards Trump could flip specific swing states, as national shifts can and will have an impact in both swing and non-swing states. To be conservative in his analysis, JMC is assuming that only half of a national popular vote shift (percentage-wise) would occur in a swing state, since those states (which get an oversized amount of attention from either side) tend to be less elastic in their movement towards a candidate.
Still, even with this conservative analysis, any movement towards Trump relative to a 4.5% national popular vote deficit would “flip” states to Trump that narrowly voted for Biden in 2020. Even a Kamala Harris national popular vote win of 3.5% (a shift of only 1% towards Trump, in other words) would flip Arizona and Georgia, and those two flips alone would get Trump up to 262 electoral votes – 8 electoral votes shy of a victory. A Harris win of 2.5% (a 2% shift towards Trump relative to 2020) would then flip Wisconsin and get Trump to the necessary 270 electoral votes.
To translate that theory into “real world” terms, the last seven days of national polling show an average lead for Kamala Harris of 1.9% (she’s up 48.3-46.5% over Trump), which would translate to 291 electoral votes for Trump. In other words, a 1.9% Harris lead equals a 2.6% swing to Trump relative to his 2020 popular vote loss. A swing of that magnitude (even accounting for swing states’ inelasticity relative to the rest of the country) would flip Arizona, Georgia, Pennsylvania, and Wisconsin and give Trump the electoral votes he needs to win. Below is a representation of the electoral college impact of various national popular vote possibilities.
National popular vote shifts v the Electoral College
The early vote
While technically Election Day is November 5, an increasing number of voters are choosing to vote before that. Research done shows that 45% voted early in 2016, and that number surged to 69% in 2020. While the pandemic/mass adoption of mail voting certainly contributed to the increase in early voting in 2020, the reality is, Election Day voting has nevertheless become a thing of the past for an increasing number of people, which DOES impact the timing of when campaigns need to disseminate their messaging to voters.
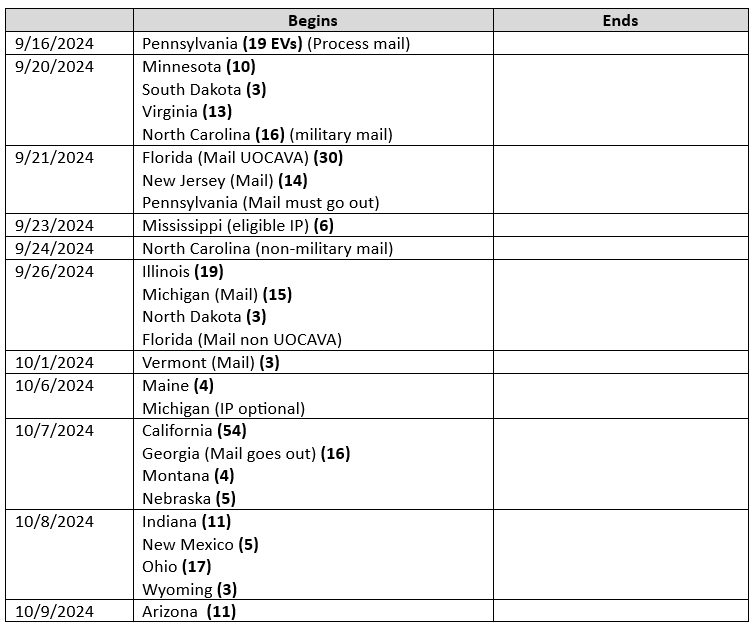
In practical terms, “Election Day” would have begun when North Carolina was scheduled to send out mail ballots on September 6. However, the North Carolina Court of Appeals at the very last minute ordered that mail ballots due to be sent off instead be reprinted without Robert F. Kennedy, Jr’s name on them. The North Carolina Supreme Court concurred with the Appeals Court ruling; so now, military mail ballots will go out on September 20, while non military mail ballots will go out September 24.
Meanwhile, as we move through the early voting calendar, in person early voting will commence on September 20 in Minnesota, South Dakota, and Virginia. After that, more states will join in (both with mail and in person voting) as we advance through the election calendar, and by October 8, states constituting a majority of the Electoral College will have their “Election Days” underway. Below is a calendar of the next 30 days of early voting:
Early voting schedule (partial)
Early Voting Data
Even with the delayed launch in North Carolina, we DO have available data on mail ballot requests in 21 states, and currently, 47.6 million (up from 731K a week ago) are already wanting to vote. Furthermore, 77 ballots in three states (Florida, Georgia, and Pennsylvania) have already been turned in. These figures will skyrocket with each passing week.

Early Voting Counts as of September 14
What’s interesting about these partial statistics: (1) mail voting volume is substantially down relative to 2020, and (2) mail requests are notably less Democratic – in 8 states where JMC has data, mail ballot requests are 45% less than they were at this point in time in 2020. Furthermore, the partisan tilt of ballot requests in 2020 for three states where we have data was 54-30% Democratic/Republican; in those same states this year, the Democratic margin is 50-32%, or a narrowing of the Democratic lead from 24 to 18 points.
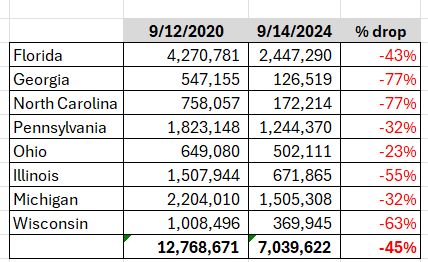
Mail Request Counts, 2024 v 2020
It’s also worth noting that as of the time of this article, 77 ballots in three states (Florida, Georgia, and Pennsylvania) have been cast, and those ballots are 57-32% Democratic. As more data comes in, we can then compare the partisan composition of actual votes to the 2020 numbers.
Granted, these are limited datasets, but they have been consistent with other data JMC has analyzed regarding partisan primary turnout and new voter registrations in August and September that show a reduced level of voter enthusiasm, and that decline is disproportionately on the Democratic side.
Conclusion
Even though the Republicans have had a rough time in the polls since the Biden withdrawal, the polling numbers have stabilized with a small Harris lead that makes it possible for Donald Trump to amass 270 electoral votes. And while the debate has likely benefitted Harris, a complete assessment of the extent of the change in the poll numbers don’t be until next week.
Meanwhile, early voting will begin to accelerate, which means in practical terms that the peak of campaign season (in terms of reaching the maximum number of movable voters) will actually be over the next two weeks, because states will be steadily ramping up their early voting throughout October, and by then, those who have voted become irrelevant to either campaign from either a persuasion or a turnout perspective.